Four Billion Rows,
Twenty Years of Debt:
A Migration Story
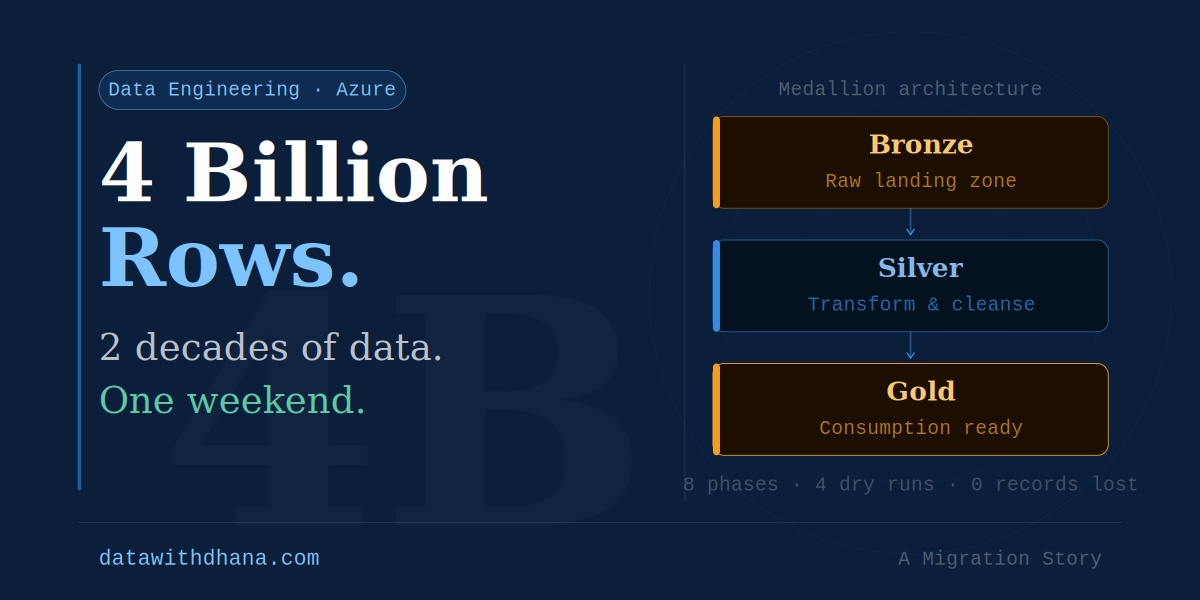
How we moved two decades of business-critical data — 4 billion rows — from an IBM DB2 mainframe to Azure across subscription boundaries, through a medallion architecture, without losing a single record.
Some data migrations are routine. Export a table, import a table, done. This was not that.
The source system had been running for over two decades. It had been patched, extended, reimplemented, and patched again. Entire business units had been built on top of it. And sitting inside an IBM DB2 mainframe at the vendor’s data centre were four billion rows of business-critical records — master data, transactional history, operational reference data, and process audit logs — accumulated since the early 2000s.
What we tackled was a full-scale migration off that mainframe — through a vendor’s Azure subscription, across a private network boundary, through a purpose-built medallion lake, and ultimately into our production Azure Hyperscale database. Eight phases, four dry runs, a load that initially took four days, a parallel run to catch what tests alone cannot, and one very detailed run book. Here’s how we did it.
Four billion rows is not an abstract number. At a modest average row size, that’s terabytes of structured data carrying over two decades of business logic baked into its values, its nulls, and its edge cases. Every design decision — parallelism strategy, validation coverage, dead-letter routing — needed to be made at this scale from day one.
The Architecture at a Glance
Before diving into the phases, here is the full data journey — from the mainframe to the hands of business consumers. The cross-subscription boundary was one of the more interesting challenges: a Private Endpoint established a secure, private network connection between our Azure subscription and the vendor’s — no public internet traversal.
The Eight-Phase Roadmap
We structured the migration into eight distinct phases — from understanding the source to verifying the result. Each phase had clear entry and exit criteria before the next could begin.
Phase 1 — Discovery
Before a single byte moves, you need to understand the data deeply — not just its schema, but its meaning. A system that has been running for two decades carries more than data: it carries the scar tissue of every business decision, every workaround, every field repurposed for a use it was never designed for. We ran workshops with the vendor’s subject matter experts to map business processes end-to-end, distinguishing data that drove live business logic from orphaned reference data that had simply accumulated since the early 2000s. Several tables had not been written to in over eight years.
Phase 2 — Data Modelling
Legacy mainframe schemas carry decades of design decisions. Rather than a 1:1 lift-and-shift, we designed a new data model that matched how the business actually works today — consolidating overlapping tables and dropping attributes that had never been populated in production. Two decades of accumulated schema drift meant many columns were structurally present but semantically dead.
“Resist the urge to faithfully replicate every legacy design choice. The migration is your opportunity to fix what was never quite right the first time — and with twenty years of drift, there was plenty to fix.”
Phase 3 — Medallion Architecture
The three-layer medallion pattern was central to our approach. Each layer has a distinct contract — and violating those contracts is how pipelines become unmaintainable at scale.
Bronze lands everything raw — your safety net if anything goes wrong downstream. At four billion rows, that safety net is not optional: when transformation logic changed mid-project (and it did), we re-derived Silver and Gold from the same Bronze data without going back to the source. Silver is where transformations, deduplication, and business rules are applied: clean, semantically correct, domain-agnostic. Gold shapes that clean data for specific consumers and feeds directly into Azure Hyperscale DB as the serving layer.
The Load That Took Four Days — and How We Fixed It
Our first end-to-end dry run completed the initial full load in just over four days. For a production cutover with a target maintenance window measured in hours, that was clearly not acceptable. The bottleneck analysis was humbling — large tables were being loaded sequentially, transformation pipelines were not exploiting available concurrency, and network throughput to the Private Endpoint was being consumed by a single thread.
The parallelisation strategy had four pillars. First, index management: all non-clustered indexes were dropped on every target table before the load began and rebuilt after completion — eliminating the overhead of maintaining index integrity on every row insert across four billion records, which alone delivered a substantial reduction in load time. Second, table partitioning: large tables were split into key-range partitions and loaded concurrently across independent ADF pipeline threads. Third, independent pipeline lanes: tables with no foreign-key dependencies on each other were grouped into parallel ADF lanes, so reference data, large transaction tables, and mid-tier tables loaded simultaneously. Fourth, dependency-aware sequencing: tables with dependencies were sequenced so parent tables completed before child tables started — maintaining referential integrity without serialising the entire load.
The Parallel Run — Catching What Tests Alone Cannot
Data quality tests and dry runs are powerful, but they operate on snapshots. Real production traffic is different: it produces edge cases, timing windows, and data combinations that no test suite fully anticipates. Before we committed to cutover, we ran a parallel period — operating both the legacy mainframe and the new Azure platform simultaneously, with live production data flowing through both and outputs compared continuously.
The parallel run is where theory meets reality. Both the legacy IBM DB2 system and the new Azure platform received the same live production data and their outputs were compared record-by-record. Discrepancies fell into three categories: known differences (intentional rationalisation we’d modelled), data quality issues in the legacy system that were newly visible now that we had a clean target to compare against, and a small category of genuine transformation bugs — logic errors that no dry run had surfaced because the specific combination of values simply hadn’t appeared in any test dataset. The parallel run found all of them.
“The parallel run found three transformation bugs that four dry runs and thousands of validation rules had not. Twenty years of production data contains value combinations you will never think to test for. Run both systems together and let the comparison do the work.”
Phase 4 — Dry Runs
Each of the four dry runs was a full end-to-end simulation. With each iteration we identified pipeline bottlenecks, refined sequencing, tightened timing estimates, and evolved the parallelisation approach. By run four, every step had a known duration — which fed directly into the production run book.
Run 1 established the baseline — and exposed the four-day load problem. Run 2 introduced the parallelism strategy and, critically, disabled all non-clustered indexes on target tables before loading, which cut the load time dramatically. Run 3 fine-tuned partition counts, ADF lane widths, and dependency sequencing. Run 4 was the final dress rehearsal: stable timings, known durations at every step, and a complete run book. Nothing happened on cutover day that the team hadn’t already done before.
Phase 5 — Data Quality Testing
Row counts are necessary but not sufficient — particularly across twenty years of accumulated data. We built domain-scoped quality rules: referential integrity, key uniqueness, value ranges, cross-table consistency, and temporal validity checks. Source data was compared against target at every transformation stage to catch records that were present but silently transformed incorrectly. Legacy systems with two-decade histories often contain data that was valid under rules that no longer apply — our test suite needed to distinguish those from actual migration errors.
Phase 6 — Production Cutover
After four dry runs and a successful parallel period, the production cutover was the most rehearsed event on the team’s calendar. But at four billion rows, even a well-rehearsed plan encounters operational reality. Here is how the cutover was structured.
The run book captured every step — owners, expected durations (calibrated across four dry runs), go/no-go checkpoints, and an explicit rollback plan. The cutover followed a defined sequence: legacy system write-lock, then the parallel ADF full load with all indexes disabled on the target tables, followed by index rebuild once the load completed, a validation sweep across all business domains, and finally traffic switch-over. Running the ADF pipelines in parallel — with indexes offline — was the combination that made the load window achievable. Three formal go/no-go decision points during the load meant the team was never more than one step from a tested rollback position.
The parallel run had done its job — by the time we hit cutover, the divergence rate between legacy and new outputs was below 0.01%. The load completed ahead of the window estimate. The rollback was never needed.
Phase 7 — Failed Record Handling
Not every record loads cleanly — and designing the pipeline to halt on every error is a recipe for a cutover that never completes. At four billion rows, a halting strategy is simply not viable.
Any record that failed during the load was redirected to an isolated staging area rather than blocking the main pipeline. The primary load continued uninterrupted. Failed records were catalogued with their source identifiers, failure reason codes, and the pipeline step at which they failed — and handed to the business team for investigation and manual remediation, with full traceability back to the source record.
Phase 8 — Reconciliation
The migration ends when you can prove it. At four billion rows across twenty years of history, the reconciliation report was not a formality — it was the evidence that the migration had happened correctly. We produced counts by entity, validation pass/fail rates, volumes redirected to the dead-letter store, and a complete attestation that every source record was accounted for end-to-end. The parallel run divergence history was included as supplementary evidence. This became both the sign-off document and the baseline for future data lineage queries.
What We’d Do Differently
Start the parallel run earlier. We ran it after the dry runs as a final validation gate — but running it concurrently with later dry runs would have caught the transformation bugs before run four rather than after it.
Design for parallelism from day one rather than retrofitting it after run one’s four-day result. The dependency graph exercise — mapping which tables could be loaded concurrently — should have been completed during the data modelling phase, not the optimisation phase.
Invest more in the discovery phase than feels necessary. Every hour spent understanding a twenty-year-old system’s accumulated quirks saves three hours of puzzled debugging later. The Bronze layer proved its greatest value mid-project: when transformation logic changed, we re-derived Silver and Gold without going back to the source.
Mainframe-to-cloud migrations at this scale are among the most complex data engineering challenges in the enterprise. Four billion rows. Twenty years of history. One shot at a production cutover. With the right architecture, disciplined process, a healthy respect for edge cases — and a parallel run that refuses to let hidden issues stay hidden — they are entirely tractable.


Leave a comment